Author

admin

Browsing

NorthStar Gaming Holdings Inc. (TSXV: BET,OTC:NSBBF) (OTCQB: NSBBF) (‘NorthStar’ or the ‘Company’) today announced that its Board of Directors approved the grant of equity incentive awards pursuant to the Company’s Equity Incentive Plan (the ‘Plan’).

The Company has granted an aggregate of 5,078,913 deferred share units (‘DSUs’) pursuant to the Plan to non-executive directors of the Company in lieu of cash compensation for their services rendered in 2024. Satisfying the compensation in share-based compensation is part of the Company’s ongoing efforts to reduce costs. The DSUs vest immediately and may only be redeemed upon a holder ceasing to be a director of the Company.

The grant of DSUs is subject to the approval of the TSX Venture Exchange.

About NorthStar

NorthStar proudly owns and operates NorthStar Bets, a Canadian-born casino and sportsbook platform that delivers a premium, distinctly local gaming experience. Designed with high-stakes players in mind, NorthStar Bets Casino offers a curated selection of the most popular games, ensuring an elevated user experience. Our sportsbook stands out with its exclusive Sports Insights feature, seamlessly integrating betting guidance, stats, and scores, all tailored to meet the expectations of a premium audience.

As a Canadian company, NorthStar is uniquely positioned to cater to customers who seek a high-quality product and an exceptional level of personalized service, setting a new standard in the industry. NorthStar is committed to operating at the highest level of responsible gaming standards.

NorthStar is listed in Canada on the TSXV under the symbol BET and in the United States on the OTCQB under the symbol NSBBF. For more information on the company, please visit: www.northstargaming.ca.

No stock exchange, securities commission or other regulatory authority has approved or disapproved the information contained herein. Neither the TSXV nor its Regulation Services Provider (as that term is defined in the policies of the TSXV) accepts responsibility for the adequacy or accuracy of this press release.

Cautionary Note Regarding Forward-Looking Information and Statements

This communication contains ‘forward-looking information’ within the meaning of applicable securities laws in Canada (‘forward-looking statements’), including without limitation, statements with respect to the following: expected performance of the Company’s business, and the timing of the release of the Company’s financial results. The foregoing is provided for the purpose of presenting information about management’s current expectations and plans relating to the future and allowing investors and others to get a better understanding of the Company’s anticipated financial position, results of operations, and operating environment. Often, but not always, forward-looking statements can be identified by the use of words such as ‘plans’, ‘expects’, ‘is expected’, ‘budget’, ‘scheduled’, ‘estimates’, ‘continues’, ‘forecasts’, ‘projects’, ‘predicts’, ‘intends’, ‘anticipates’ or ‘believes’, or variations of, or the negatives of, such words and phrases, or state that certain actions, events or results ‘may’, ‘could’, ‘would’, ‘should’, ‘might’ or ‘will’ be taken, occur or be achieved. This information involves known and unknown risks, uncertainties and other factors that may cause actual results or events to differ materially from those anticipated in such forward-looking statements. This forward-looking information is based on management’s opinions, estimates and assumptions that, while considered by NorthStar to be appropriate and reasonable as of the date of this press release, are subject to known and unknown risks, uncertainties, assumptions and other factors that may cause the actual results, levels of activity, performance, or achievements to be materially different from those expressed or implied by such forward- looking information. Such factors include, among others, the following: risks related to the Company’s business and financial position; risks associated with general economic conditions; adverse industry risks; future legislative and regulatory developments; the ability of the Company to implement its business strategies; and those factors discussed in greater detail under the ‘Risk Factors’ section of the Company’s most recent annual information form, which is available under NorthStar’s profile on SEDAR+ at www.sedarplus.com. Many of these risks are beyond the Company’s control.

If any of these risks or uncertainties materialize, or if the opinions, estimates or assumptions underlying the forward-looking information prove incorrect, actual results or future events might vary materially from those anticipated in the forward-looking statements. Although the Company has attempted to identify important risk factors that could cause actual results to differ materially from those contained in the forward-looking statements, there may be other risk factors not presently known to the Company or that the Company presently believes are not material that could also cause actual results or future events to differ materially from those expressed in such forward-looking statements. There can be no assurance that such information will prove to be accurate, as actual results and future events could differ materially from those anticipated in such information. No forward-looking statement is a guarantee of future results. Accordingly, you should not place undue reliance on forward-looking information, which speaks only as of the date made. The forward-looking information contained in this press release represents NorthStar’s expectations as of the date specified herein, and are subject to change after such date. However, the Company disclaims any intention or obligation or undertaking to update or revise any forward-looking information whether as a result of new information, future events or otherwise, except as required under applicable securities laws.

All of the forward-looking information contained in this press release is expressly qualified by the foregoing cautionary statements.

For further information:

Company Contact:
Corey Goodman
Chief Development Officer 647-530-2387
investorrelations@northstargaming.ca

Investor Relations:
RB Milestone Group LLC (RBMG)
Northstar@rbmilestone.com

To view the source version of this press release, please visit https://www.newsfilecorp.com/release/258672

News Provided by Newsfile via QuoteMedia

This post appeared first on investingnews.com

Ndamukong Suh announced his retirement on Saturday. Some of you will know that name. Some of you will not. Everyone who follows the NFL and appreciates its history should have a deep appreciation of who Suh was. What he represented. All of him. The good, the bad, the really ugly. So here it is.

Suh was in many ways a representative of the NFL before it became the league we see now. He was an old-school football dude in a 21st-century era. If there was a player today who embodied the clotheslining, cheap-shotting, step-on-a-player’s leg while they’re down era of the 1970s, it was Suh. In fact, Suh actually did step on a player’s leg while he was down. He did it to Aaron Rodgers.

Suh was dirty. That’s not an opinion. That’s who Suh was. Don’t take my word for it. His peers said the same. The Sporting News in 2012 asked 103 players who was the dirtiest in the NFL and Suh was at the top of the list. He earned that position.

‘There’s not many guys in this league like that guy,’ former Patriots running back LeGarrette Blount said in 2017. ‘He’s a dirty player. He’s always been a dirty player. There’s no room in the game for that. At some point in time, guys have to defend themselves when he’s doing the things that he does.’

Suh was fined hundreds of thousands of dollars for various late hits, dirty plays and on-field illegalities. In fact, by 2023, he had racked up a staggering $420,669 in fines. Part of that unreal total was a $100,000 fine for a low block against Minnesota’s John Sullivan in the 2013 season opener.

This is who Suh was. But there is another part of him.

I was a massive critic of Suh, but I always appreciated how he was unapologetic about who he was, and I believe Suh saw football for what it really is: at times, and perhaps most of the time, a brutal sport played by tough people. That’s it. That’s all. Not the game that the league and networks sell. The beautified game. The flashy game. That’s not who Suh was.

It’s hard to put into words just how offenses feared Suh. Quarterbacks were terrified of him for legitimate reasons. But also, teams feared him because he was physically devastating, not just a cheap shot guy.

Busted knees, a fractured throat: Don’t forget harsh price NFL players pay

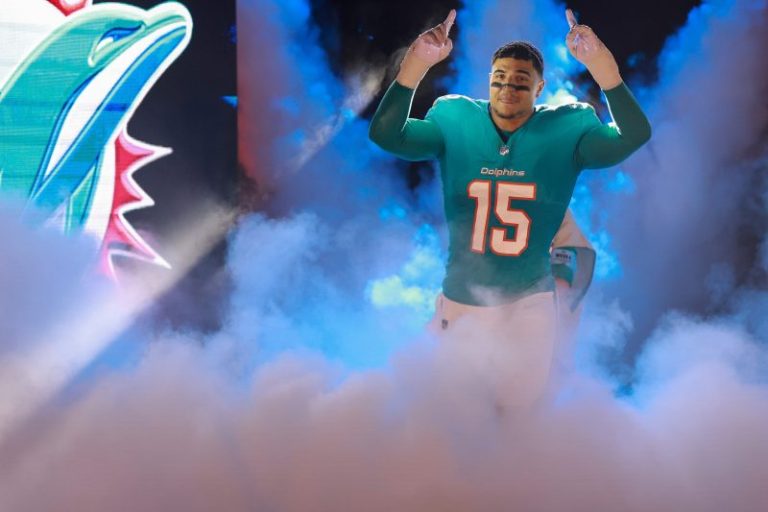
Suh was the second overall pick in the 2010 draft and the league’s defensive rookie of the year. He dominated in Detroit and then signed a deal with Miami that, at the time, made him the highest-paid defensive player in NFL history. After the Dolphins, he played for the Rams and Buccaneers before ending his career in Philadelphia.

The point is, besides the dirtiness, he was really good. Like, historically good. Suh played in Super Bowls for each of his last three teams, something that almost never happens in NFL history. According to Pro Football Talk, the short list of players who have played in Super Bowls for three different franchises includes Rod Woodson (Steelers, Ravens, Raiders), Bill Romanowski (49ers, Broncos, Raiders), Preston Pearson (Colts, Steelers, Cowboys), Harry Swayne (Chargers, Broncos, Ravens) and Joe Jurevicius (Giants, Buccaneers, Seahawks).

To me, he is a Hall of Famer.

And no, the cheap shot stuff shouldn’t keep him out. It should be noted, and debated, but he was, without question, one of the great defensive players of his era. That’s the bottom line in making that type of decision.

I have to tell you something else about Suh. Just one last thing.

You can see some of what these people who spoke to me meant when reading Suh’s thoughtful and heartfelt retirement post, which starts by noting he was retiring on the same day, a year later, that his father died.

“It’s the day I said goodbye to my father, the man who raised me, shaped me, challenged me, and believed in me before I believed in myself,” Suh wrote. “He wasn’t just a dad. He was my idol, my coach, and my anchor. He taught me what it meant to be disciplined, focused, and relentless in everything I do. Every snap I took in football carried his fingerprint. Every time I lined up across from someone, I could hear his voice pushing me, reminding me that I wasn’t just representing myself. I was representing him, my family, my name. Before he passed, he gave me one final piece of advice, ‘It’s time to let football go. You’ve done everything you set out to do. Now it’s time for the next chapter.’”

That next chapter should include a trip to Canton.

This post appeared first on USA TODAY

ATLANTA — As Major League Baseball’s All-Star Game loses just a shimmer of star power, the league made sure to let the world know Tuesday night’s pitching matchup will be top-notch.

For the second consecutive season, fireballing Pittsburgh Pirates right-hander Paul Skenes will start for the National League, opposed by Tarik Skubal, the reigning American League Cy Young Award winner and the undisputed best pitcher in baseball at the moment.

Pitting Skenes against the Detroit Tigers ace takes some sting out of losing a minivan’s worth of stars declining to participate in the game, led perhaps most notably by Zack Wheeler, Philadelphia’s 35-year-old ace who opted to rest instead of take part in his fourth Midsummer Classic.

Had Wheeler, who pitched Saturday night against the San Diego Padres, opted to participate, it would have created a tough decision for MLB and NL manager Dave Roberts. Wheeler has likely had the objectively superior first half – though not by much – leaving the league to decide between Wheeler and the buzzier, if you will, Skenes.

That won’t be a problem come Tuesday, as Skenes, who has a 4-8 record despite 4.8 WAR and a 2.01 ERA, will throw the first pitch at Truist Park against the AL All-Stars. Skenes will be first out the chute for the AL, thanks to his 2.23 ERA and a staggering 153 strikeouts in 121 innings.

Other stars who have opted out or been replaced due to the timing of their final first-half starts include Seattle Mariners outfielder Julio Rodriguez, Cleveland Guardians third baseman Jose Ramirez and Texas right-hander Jacob de Grom. Others, like Atlanta lefty Chris Sale and Boston Red Sox third baseman Alex Bregman, are either injured or returned very recently from injury and won’t play.

The USA TODAY app gets you to the heart of the news — fastDownload for award-winning coverage, crosswords, audio storytelling, the eNewspaper and more.

This post appeared first on USA TODAY

A massive injury may alter all of WWE.

Seth Rollins appeared to suffer a legitimate injury during Saturday Night’s Main Event, putting the immediate future of one of the company’s biggest stars in jeopardy.

The injury occurred during a match against LA Knight. Rollins was on the attack and had attempted a moonsault in the ring when his knee buckled. Rollins immediately went down and grabbed at his right knee. He backed into the corner of the ring and talked to the referee and Paul Heyman. LA Knight tried to attack Rollins but the referee stopped anything from happening.

A ringside doctor eventually came and checked in on Rollins. ‘The Visionary’ briefly spoke with the WWE staffer before he got to his feet. LA Knight hit the BFT and got the pin for the win in what seemed like a quick adjustment to the ending.

After the match, people inside Atlanta’s State Farm Arena took photos of medical personnel checking on Rollins. A video of Rollins circulating on social media showed his clear frustration, the wrestler barking expletives and requiring help to leave the ring. 

While the extent of Rollins’ injury is currently unknown, it could be catastrophic and potentially means some big changes to storylines. Rollins is Mr. Money in the Bank, able to cash it in for a championship opportunity at any time, and there was speculation he would do it at Saturday Night’s Main Event.

With Heyman, Bronson Reed and Bron Breakker part of his stable, Rollins was also on a hot streak ever since his WrestleMania 41 win in April. The group has become one of the most menacing in WWE.

Seth Rollins update

Seth Rollins injury history: Knee injuries have plagued career

The apparent knee injury on July 12 is just the latest one for Rollins. Knee injuries have put him on the shelf several times in the past.

In November 2015, Rollins tore the anterior cruciate ligament (ACL), medial collateral ligament (MCL) and meniscus in his right knee during a live event in Ireland. He was the WWE World Heavyweight Champion and had to relinquish the title as he required surgery. He was out for seven months. Rollins then re-tore the MCL in the same knee in January 2017. Despite requiring another surgery, he didn’t miss much time.

He tore his meniscus again in January 2024, but this time in his left knee. Even though he was injured, Rollins still appeared in WWE in the build-up to WrestleMania 40. He wrestled both nights of the event with the torn meniscus, and was instrumental in the Cody Rhodes vs. The Rock and Roman Reigns storyline. He missed two months of action following the event.

While knee injuries have been a constant problem for Rollins, he has also dealt with back issues throughout his career.

This post appeared first on USA TODAY

The New York Yankees All-Star outfielder became the fastest player ever to hit 350 career home runs, setting the mark with a two-run blast in the ninth inning off Chicago Cubs reliever Brad Keller. Judge took a 97-mph four-seam fastball on an 0-2 count, supplanting the ball into right center field to get the Yankees on the board.

New York lost the game 5-2. The home run was Judge’s 35th of the season, and it was his 1,088th game in the majors. Mark McGwire had the previous record, hitting his 350th home run in his 1,280th game. The 33-year-old Judge was also the fastest to reach 250 and 300 career home runs, and McGwire is the fastest to 400 roundtrippers (1,412 games).

Judge, a two-time American League Most Valuable Player, is hitting .358 with 35 home runs and 81 RBI. Judge leads the majors in hits (125), OPS (1.204), slugging percentage (.739), and wins above replacement.

Aaron Judge blasts 350th home run

Here is a look at the historic home run.

This post appeared first on USA TODAY

Houston Rockets guard Fred VanVleet was elected the new president of the National Basketball Players Association during the Board of Player Representatives meeting on Saturday.

He will begin a four-year term immediately, succeeding CJ McCollum.

VanVleet recently signed a two-year, $50 million contract to stay in Houston. The veteran guard won an NBA championship with the Toronto Raptors in 2019 and was named an All-Star in 2022. He also set records for the highest-paid contract for an undrafted player.

McCollum, who was recently traded to the Washington Wizards, saw his term expire. He had served as NBPA president since August 2021. In 2023, McCollum led the players’ association in negotiations to complete a seven-year collective bargaining agreement.

He’s expected to stay involved in the NBPA, moving into an advisory role.

This post appeared first on USA TODAY

Up to this point, the S&P 500 ($SPX) has now stayed above the 6,200-mark for eight straight days. The upside follow-through has been limited, but the drawdown has also been shallow. The onus continues to be on the bears to do something with the stretched state. We discuss this in terms of the CappThesis Market Strength Indicator below.

What Is the Market Strength Indicator (MSI)?

When the market makes strong moves, like they have recently, I like to review our Market Strength Indicator (MSI).  This isn’t some secret, proprietary formula. It’s a simple blend of trend, oscillator indicators, and patterns, factors that we base our market stance upon.

And surprise, surprise, the MSI is as bullish as can be with the SPX at new highs and up 30% in three months.

  1. The S&P 500 is trading above each moving average, and each moving average is sloping higher.
  2. The 14-day Relative Strength Index (RSI) and Williams %R are both overbought. We use both of these since it takes a considerable up move to get the RSI to overbought territory. And while the Williams %R swings to extremes much more easily, it can only stay overbought if the market continues to tick higher with minimal drawdowns. Clearly, all of this has been happening.
  3. And, of course, two big pattern breakouts remain in play. Two weeks ago, the MSI was even more extreme when we had four patterns in play at the same time.

Here are each of those indicators together on one chart. (We don’t show the patterns here since it would be way too much to display all at once – and that would be an offensive chart crime.)

The clear next question:

Now what?

Market Strength Indicator Now vs. April 7, 2025

First, the obvious. The MSI was completely depressed on April 7 after two months of intense selling and extreme volatility.

Interestingly, though, after that last massive downside gap on April 7, the final bearish pattern target was hit. That set the stage for a bottoming process to potentially begin.

With the pendulum now having completely swung from historically oversold to now extended, does a very bullish MSI suggest the upswing is unsustainable?  

Bulls and bears agree on one thing these days: The pace of the last three months can’t continue, and at any time, a pullback greater than the 3.5% drop from mid-May is going to happen. It’s just a matter of when. 

Now let’s look at the recent times when the MSI got to extreme levels like now.

Market Strength Indicator Now vs. 2023–24

The results are crystal clear. “Extreme” MSI readings are the result of strong technicals, which occur in uptrends. And uptrends tend to last longer than many think is possible or probable.

From this perspective, only once did a correction begin right after a high MSI reading – in July’24. At the time, though, only one bullish pattern was in play (the one with the long-term 6,100 target that was triggered way back in Jan’24). 

Now, of course, we have two live bullish formations, and for the uptrend to persist without a major market disturbance, we’ll need to see the next bout of profit-taking morph into the next set of short-term bullish formations.

Live Patterns

Our two live patterns remain – targets of 6,555 and 6,745, which could be with us for a while going forward. For those to eventually be achieved, though, new, smaller versions will need to be constructed.

Live Patterns

Our two live patterns remain – targets of 6,555 and 6,745, which could be with us for a while going forward. For those to eventually be achieved, though, new, smaller versions will need to be constructed.

If you’re serious about trading or investing, establishing a weekly market routine is a must. But where do you begin?  

In this eye-opening video, Grayson Roze, Chief Strategist at StockCharts, shares the method he uses every week to stay aligned with the market’s biggest drivers — the top 25 stocks by market cap

Learn how to build a customized ChartList of these stocks, sort the stocks by market cap, and different ways to review them to spot long-term trends or reversals.

Whether you’re new to charting or a seasoned technician, this routine could transform how you view the market. 

This video originally premiered on July 11, 2025. Click on the above image to watch on our dedicated Grayson Roze page on StockCharts TV.

You can view previously recorded videos from Grayson at this link.

The S&P continues to push higher, with the equity benchmark almost reaching 6300 this week for the first time in history. With so many potential macro headwinds still surrounding us, how can the market continue to reflect so much optimism? On the other hand, when will bulls wake up and realize that this market is obviously overextended and rotate significantly lower?

With the S&P 500 once again achieving new all-time highs, and with Q2 earnings just around the corner, I thought it would be a perfect time to revisit an exercise in probabilistic analysis. Basically, I’ll lay out four different scenarios for the S&P 500 index between now and late August. Which path do you see as the most likely and why? Watch the video, check out the first scenarios, and then cast your vote!

By the way, we last ran this analytical process on the S&P 500 back in May, and check out which scenario actually played out!

And remember, the point of this exercise is threefold:

  1. Consider all four potential future paths for the index, think about what would cause each scenario to unfold in terms of the macro drivers, and review what signals/patterns/indicators would confirm the scenario.
  2. Decide which scenario you feel is most likely, and why you think that’s the case. Don’t forget to drop me a comment and let me know your vote!
  3. Think about how each of the four scenarios would impact your current portfolio. How would you manage risk in each case? How and when would you take action to adapt to this new reality?

Let’s start with the most optimistic scenario, with the S&P 500 index continuing the recent uptrend phase to retest all-time highs by June.

Option 1: The Super Bullish Scenario

The most bullish scenario would involve the S&P 500 continuing a similar trajectory that we’ve seen off the April low. Growth continues to dominate, tariffs remain essentially a non-issue, volatility remains lower, and the market moves onward and ever upward!

Dave’s Vote: 10%

Option 2: The Mildly Bullish Scenario

What if the uptrend continues, but at a much slower rate? The “mildly bullish scenario” would mean the S&P 500 probably tops out around 6300-6400 but doesn’t get any further. Perhaps a leadership rotation emerges, and technology stocks start to pull back as investors rotate to other sectors and themes. Lack of upside momentum from the largest growth names slows the uptrend in a big way.

Dave’s vote: 30%

Option 3: The Mildly Bearish Scenario

Maybe “the top” is already in, and even though July is traditionally a strong month, we see a corrective move into August that brings the S&P 500 down to the 200-day moving average. Bulls and bears would probably feel quite vindicated here, as bulls would see this as a healthy pullback, and bears would see this as a serious wake up call for investors.

Dave’s vote: 45%

Option 4: The Very Bearish Scenario

We always need a doomsday scenario, and here we’ll describe how the S&P 500 could go back down to retest the May price gap. If Q2 earnings season becomes all about companies reflecting on a significantly negative impact from potential tariffs, and investors begin to not just complain about overvalued stocks but actually start selling as a result, we could certainly see a downside move to retrace about 38.2% of the April to July uptrend phase.

Dave’s vote: 15%

What probabilities would you assign to each of these four scenarios? Check out the video below, and then drop a comment on which scenario you select and why!

RR#6,

Dave

PS- Ready to upgrade your investment process?  Check out my free behavioral investing course!

David Keller, CMT

Chief Market Strategist

StockCharts.com

Disclaimer: This blog is for educational purposes only and should not be construed as financial advice.  The ideas and strategies should never be used without first assessing your own personal and financial situation, or without consulting a financial professional.  

The author does not have a position in mentioned securities at the time of publication.    Any opinions expressed herein are solely those of the author and do not in any way represent the views or opinions of any other person or entity.

As we navigate the evolving stock market landscape, understanding key sectors and their trends is important, especially during earnings season. This week, the spotlight shines on the Financial sector, with several of the largest banks reporting. Five of the top 10 holdings within the Financial Select Sector SPDR ETF (XLF) are on deck: J.P. Morgan (JPM), Goldman Sachs (GS), Bank of America (BAC), Wells Fargo (WFC), and Morgan Stanley (MS). 

This week we will focus on the Financial sector via XLF and zoom in on one of its top components, Goldman Sachs.

The Financial Sector: A Technical Look at XLF

XLF has been outperforming the S&P 500 ($SPX), experiencing new all-time highs, and has been a leading sector in the most recent market rebound.

Now that all banks that were susceptible to the Fed’s stress test have passed with flying colors, questions loom about whether less stringent regulations will lead to more growth. The sector has not experienced much M&A activity, and the IPO market has yet to come back to a healthy level of activity. However, there is hope that a banking renaissance is on the horizon, and maybe this quarter will give a rosier outlook than more recent forecasts.

Technically, XLF looks promising. Shares broke out to new all-time highs ahead of earnings and are now set up with good risk/reward potential for investors. 

The pattern from which it broke out is a bit of a wonky head-and-shoulders pattern. I’d call this a stretch as it isn’t picture perfect, but the price image presented is close enough to set parameters to trade. 

The breakout on a gap to new highs is extremely bullish, and that gap level could be used as a stop-loss to the downside, worst case should be the rising 50-day moving average. Buyers should come back into the sector there on a dip.

Goldman Sachs (GS): A Bellwether

Goldman Sachs, the largest component in the price-weighted Dow Jones Industrial Average, reports results on Wednesday morning just days after hitting all-time highs. Investors will be looking for any commentary focused on tariffs and margins. 

Has there been any impact on their results, or have concerns about inflation been overblown? Any earnings pressure on their bottom line could cause ripple effects throughout other sectors like industrials, materials, and technology. 

Shares declined 33% then rallied 65% from their April 7 lows. Shares may need a breather as they are overbought, but that’s where opportunity may lie. Wouldn’t chase it just yet. I would own for the long term, but price action could be very interesting when they report next week. 

One bold prediction — look for a possible stock split announcement. Since their debut in 1999, shares have never split. Seeing the recent price surge and its size in the Dow, that option should be on the table. 

Technically, shares have been on a tremendous run as they’ve rallied 65% from their April 7 lows. Shares may need a breather as they are overbought, but that may be where the opportunity lies when they report next week. 

The stock has rallied with a series of gaps along the way. Those gaps tell a story, and it’s worth watching the most recent gap from $690 to $700. Each jump higher has not experienced a full retracement — a gap fill, if you will.

The gaps higher have been very bullish. The first large gap — a breakaway gap — started the main part of this rally. We have seen a series of smaller gaps that helped extend the rally. Now, we may be tiring. Watch the $690 level to see if that gap can hold. If it can’t, then there may be more selling pressure over the near term. 

A healthy pullback given the strong bull run is likely, but buyable. A break below $690 could see a swift move lower to the $665 level. If things turn negative, then the rising 50-day moving average, which coincides with a key Fibonacci retracement level just below $620 would be an ideal entry point from a risk/reward perspective. 

The good news is that any weakness in the stock looks like it should be met with great opportunities to enter the name. The long-term trend is up, and the momentum is there not only in the stock but within the sector. The long-term trader shouldn’t fret earnings; the swing trader may get an opportunity to buy a dip from an overbought condition. The bad news would be that the stock gaps higher again and continues its upward trajectory. 

Beyond Financials: Johnson & Johnson (JNJ)

While financials take center stage, we want to touch upon another significant company reporting this week: Johnson & Johnson (JNJ).

JNJ shares have remained relatively flat for the better part of five years. Much of the earnings focus will be on plans to navigate patent expirations. 

Merck acquired Verona last week. The patent cliff will continue to be a hot topic for the entire pharma industry. As for JNJ, it’s confronting the expiration of exclusivity on Stelara, its $10B+ immunology blockbuster drug. The exclusivity expires first in Europe this year and then in the U.S. in 2026.

As for reaction to earnings, don’t expect too much activity. The average move post-results has been +/- 2.05%. Shares have traded lower after five of the last seven times. Shares of the Dow stock are up 8% year-to-date and -9% off their highs.

Technically, there isn’t much to see here. We backed it out to look at price in a five-year weekly range to illustrate that point.

Shares have been in a wide range between roughly $138 to $168 over this lengthy span. Yes, I yawned when I typed this out — it’s that boring. We don’t expect much to change, but there are small setups for a shorter-term swing trader.

The stock, while breaking above the midpoint of this longer-term range, is forming a bullish ascending triangle and has, albeit tight, risk/reward parameters for those looking to trade. 

To the downside, look for the continued near-term uptrend to hold and find support right at the 200-day moving average just below $153. A good entry point in which one could manage risk. 

To the upside, a break above $158 could take shares to their recent highs and slowly and steadily towards the $168 level. The set-up is far from ideal when looking at the longer-term action, but near term, there could be a quick play and maybe, just maybe, shares can finally escape the longer-term neutral range.